

The AI forecasts that fit your workflow.
Not the other way around.
Whether you are a manufacturer tired of guessing demand or a distributor with too much stock, we turn your data into forecasts you can trust. A tailored AI engine that fuses your internal data with 1,000+ external signals, delivered as a subscription directly into the tools you already run — no software to install, no team to hire.

1,000+ external signals →
Weather ·
Temperature anomaly DE
Macro ·
CPI Eurozone
Calendar ·
School holidays NRW
Search ·
Trend index plant-based
Commodities ·
Wheat futures
Promo ·
BBQ season Sales
Mobility ·
Cross-border traffic
Energy ·
Power price DE
Logistics ·
Port congestion Rotterdam
Retail ·
Football DACH
Social ·
Mention velocity
Currency ·
EUR / USD
Weather ·
Temperature anomaly DE
Macro ·
CPI Eurozone
Calendar ·
School holidays NRW
Search ·
Trend index plant-based
Commodities ·
Wheat futures
Promo ·
BBQ season Sales
Mobility ·
Cross-border traffic
Energy ·
Power price DE
Logistics ·
Port congestion Rotterdam
Retail ·
Football DACH
Social ·
Mention velocity
Currency ·
EUR / USD
Increase in forecast accuracy
Lost sales & unavailability
Variable 3PL costs
Inventory Reduction
Planning systems that predict yesterday.
Forecasting hasn't kept up with reality. Most planning stacks still extrapolate from history alone — and miss the signals shaping what happens next.
01
History doesn't plan forward.
Statistical models extrapolate from past sales data, but they overlook the external factors that determine tomorrow's demand: promotional campaigns, macroeconomic developments, and trends.
02
External signals ignored.
Your ERP has no idea Veganuary starts in January, or that a competitor is running −30% promos this weekend across three regions.
03
Decisions made half-blind.
Planners compensate with spreadsheet overrides and gut feel. The result: excess stock on slow movers, stock-outs on fast ones, missed SLAs.
We run the engine.
You get the result.
A three-step pipeline. Your data and 1,000+ external signals feed a hybrid AI that's tuned per-SKU — and lands as forecasts inside the tools your team already uses.
01 / Business input
Your data plus 1,000+ signals.
We ingest your historical sales, then layer in 1,000+ curated external signals — macro, trends, commodities, calendar, promotions, prices.

02 / Forecast engine
Hybrid AI, built per product.
For each SKU we run millions of model experiments to find the optimal algorithm — then auto-retune weekly as market conditions shift.

03 / Actionable insights
Better starting numbers your team acts on.
Forecasts arrive directly in your existing planning stack — no new UI, no retraining. Your team makes the calls; we just give them stronger inputs to work from.

Into the tool you already use.
Outputs land in whatever format your team already works in — no software to install, no process to change. Your planners keep their workflow. We just give them stronger inputs.
XL
Microsoft Excel
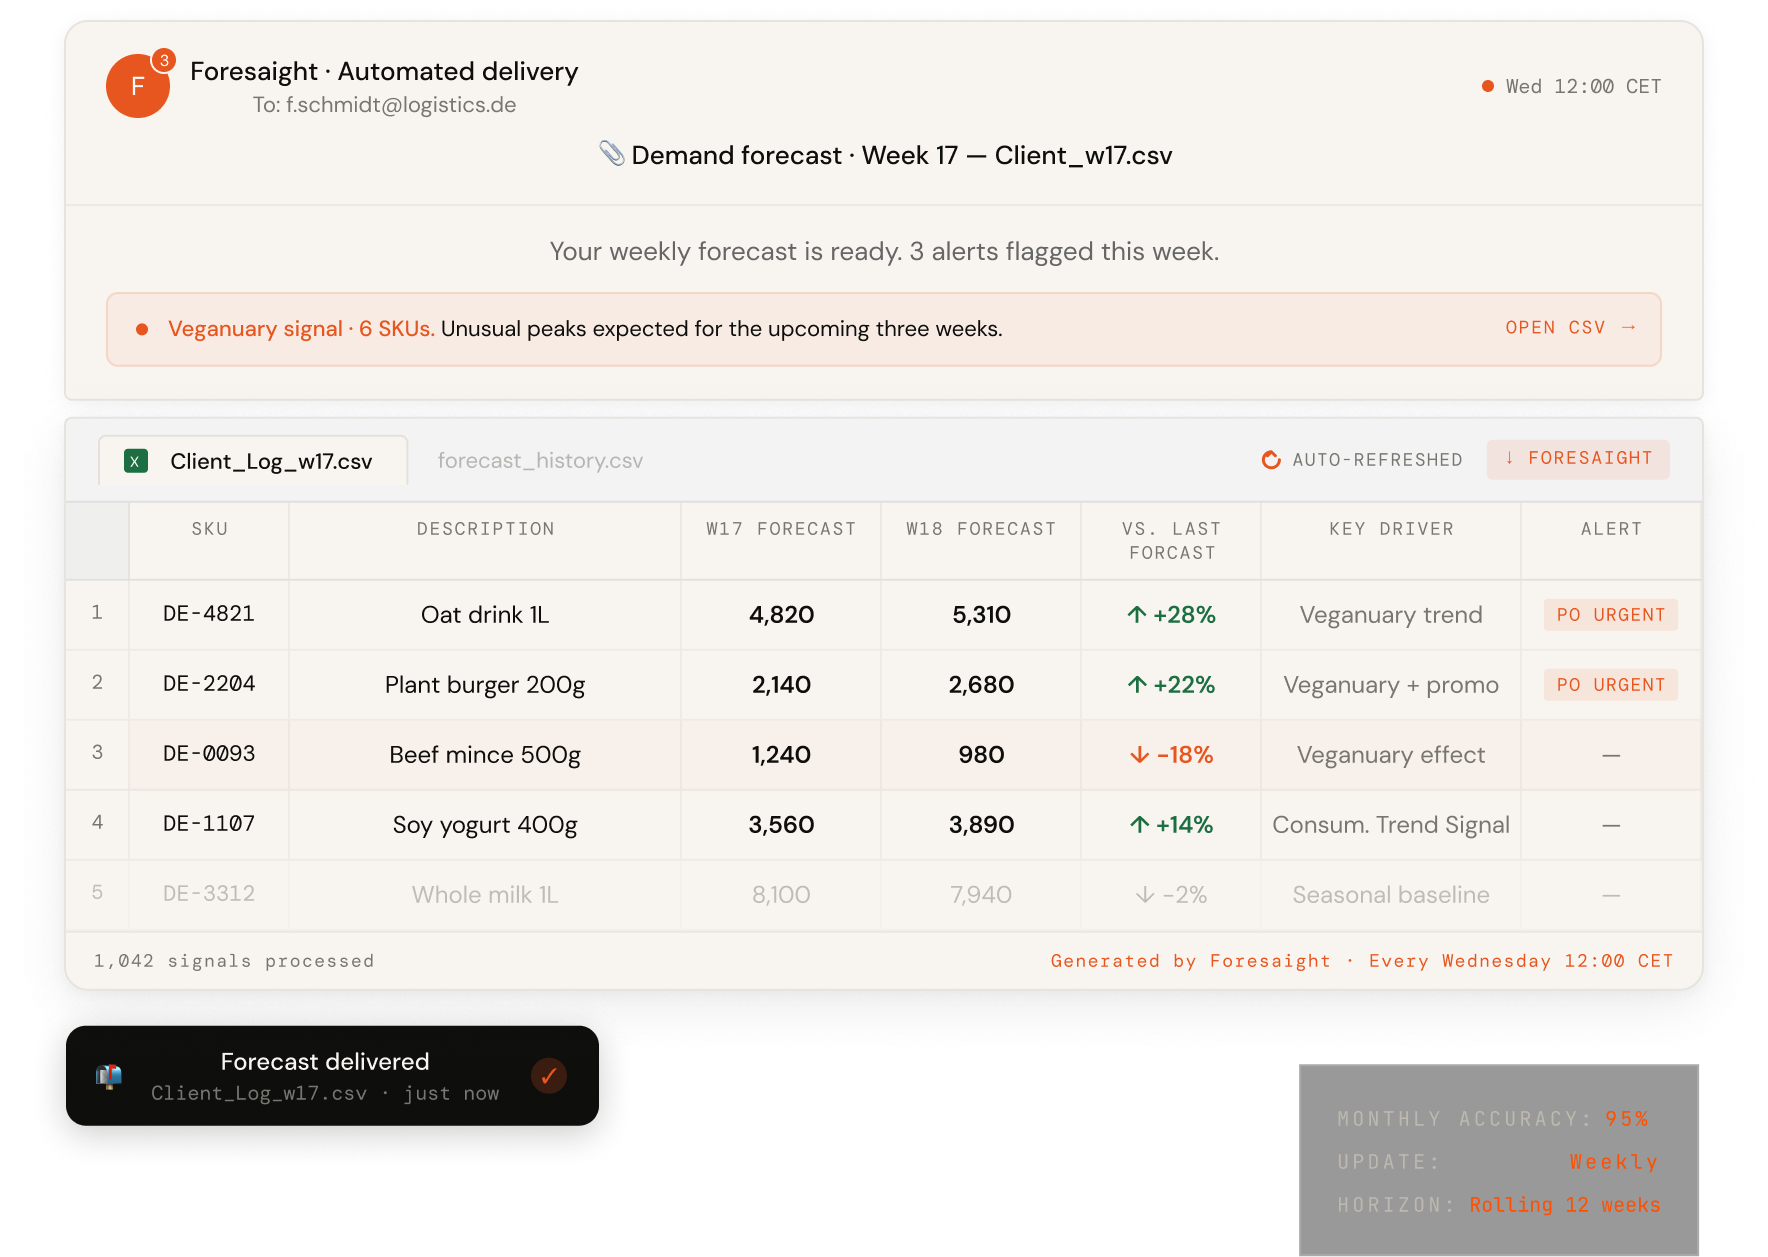
.xlsx delivered direct to shared drive or SharePoint, on schedule.
GS
Google Sheets
Auto-populated tab via service-account writes — always live.
CSV
CSV / Flat file
SFTP drop, S3 bucket or email — your existing pipeline picks it up.
{ }
REST API
JSON endpoint into your ERP, planning suite or BI layer.
The difference on Monday morning.
Same data, same team, same tools — different starting point. Pick a function to see the before/after.
Sales
Long-term revenue forecasts per product, product family or key account, so you can plan capacity, sourcing, and investment around where the market is heading, not where it's been.
Sales projections stop at next quarter. Product-level trends lost in top-line aggregates across regions. Strategic bets placed on guesswork.
Long-term demand visibility per product. Market shifts and trends in view before competitors. Capacity, sourcing, and investment, planned with conviction.
-65%
Reduction of lost sales due to product unavailability.
Source: McKinsey Global Institute
See demand before it happens.
Outpace the competition.

Inventory
Demand forecasts to drive your safety stock and replenishment, so cash isn't tied up in slow movers and fast movers don't go out of stock.
Safety stock buffers set by rule of thumb. Slow movers pile up. Fast movers stock out at the worst moment.
Per-SKU safety stocks tuned to actual demand variability. Working capital down, service levels up.
-20 to -50%
Reduction of inventory.
Source: McKinsey Global Institute
Hold the right stock.
Reduce working capital.

Logistics
Inbound and outbound volume forecasts down to the number of picks — so labour and capacity planning match real workload, not guesswork.
Personnel and 3PL capacity over-booked "just in case". Costly overtime when forecasts miss, missed deliveries when teams are short-staffed. Returns catch the team off guard.
Personnel and 3PL plans match expected volumes. Lower overtime, fewer emergency transports, more stable daily ops.
-25%
Reduction of variable 3PL costs.
Source: Foresaight client data
Forecast the workload.
Skip the emergencies.

One engine. Every planning function.
Foresaight delivers role-specific forecasts across your entire supply chain — each output calibrated to the decisions that function actually makes.


01 / Sales
Sales Lead
Sales forecasting · Demand sensing · Promo lift modeling · Customer-level granularity.
Reliable revenue numbers
Better customer commitments
Fewer surprises in S&OP

02 / Supply chain
Supply Chain Lead
Inventory & safety stock · Storage optimization · Materials availability.
Lower working capital
Fewer stockouts and overstocks
Clear service vs capital trade-offs

03 / Procurement
Purchasing Lead
Materials forecasting · Raw materials & components · Packaging planning.
Fewer urgent purchases
Better supplier negotiations
More stable inbound flows

04 / Production
Production Lead
Production scheduling · Volume planning · Capacity planning by line.
Smoother production plans
Fewer last-minute changeovers
Higher asset utilization
05 / Logistics
Transport Lead
Personnel planning · Trucks & drivers · 3PL forecasting · Returns.
Lower overtime & temp labor
Fewer emergency transports
More stable daily ops
Numbers from the shop floor.
A snapshot of what changed once Foresaight was running in production, measured against the planning systems it replaced.
Accuracy we deliver, and what it means in euros.

Storage cost optimization from optimized stock levels
Mid-size manufacturer
Reduction of idle personnel time
E-commerce distributor
Annual savings from optimized personnel planning
Third-party logistics provider
“We have been in this business for almost 100 years. This is truly a gamechanger. We saved €100k this year, from optimized personnel planning alone.”

“The collaboration with Foresaight has been exceptional from day one. Their solution delivered immediate value, enabling us to significantly optimize capacity planning while increasing forecast accuracy."

"We see double digit improvements in storage cost optimization.”

Clients




From data to live forecasts in 3 weeks.
Two phases. The first proves the engine works on your data. The second proves we can deliver it on schedule, week after week.
Phase 1
Technical Test
"Can we deliver the agreed results?"
1 day to 3 weeks
1
Kick-off · 1 hour
Define target variable, update frequency, forecast horizon, accuracy benchmark.
2
Integration meeting · 1 hour
Identify your specific demand drivers — promotions, seasonality, customer behaviour, events.
3
Data processing & model creation
We run millions of experiments per SKU to find the optimal forecasting architecture.
4
Debrief with back-testing · 1 hour
We simulate model performance against the past 12–24 months of your data.
Phase 2
Operational Test
"Can we deliver the agreed service?"
6 to 12 months
1
Forecasts delivered on schedule
In the agreed format at the agreed time — e.g. .csv on Wednesdays at 12:00 CET.
2
Weekly check-ins · 30 min
Q&A with you and your planning team. No bottlenecks, no surprises.
3
ROI & benefit tracking
We measure impact together to determine whether this is a good investment for your supply chain.
4
Continuous model improvement
Continuous model improvement
The very human team behind Foresaight.
Backed by Europe's leading deep-tech networks. Passion-led, knowledge-built.
Grant
EXIST Forschungstransfer
German federal funding for deep-tech research transfer

Winner
WECONOMY AWARD 2025/26
Most innovative start-up in Germany

Top 10
EU Supernovas
Most promising female-led start-up in Europe

Top 3
OUT OF THE BOX Award
Most innovative start-up in NRW


CEO · Product & Bus Dev
"Where data science meets the supply chain."

COO · Strategy & Ops
"Where sharp strategy becomes scale."

CTO · Tech & AI Ops
"Where tomorrow lives in today's data."
Backed by · part of